There’s this expectation of who you must be, and what your background should be like. I don’t have that background. That traditional background. It’s interesting, I’d enter a room and they’d act like basically I’m the one getting coffee. Being a person of color is still an issue in our sector, and it’s something we need to change. Also, not being male is an issue. Who’s getting the funding? Let’s take a look at that. — CHARLEY, EXECUTIVE DIRECTOR AT A TECHNOLOGY NONPROFIT
To some extent, I think sexism is probably the biggest one, then racism, then homophobia. I can’t honestly really separate them into these different categories because, for me, it’s the intersection of a lot of these. And, just being able to navigate the tech space as a woman of color who is also an immigrant […] there’s not a lot of other people that look like me or that are like me. — HIBIKI, FREELANCE DIGITAL SECURITY TRAINER
Our second research goal is to expand understanding of practitioner demographics. A summary of our key Demographics findings is available in the Executive Summary.
DEMOGRAPHICS OF THE FIELD
We conducted this research in the midst of ongoing public debate about racial and gender discrimination in the broader tech sector. A recent Pew study found that 80% of women and 66% of men say that gender discrimination is a problem in the tech sector, while two-thirds of Black people and half of Latinxs feel discrimination is a “major” problem in the tech industry.8 In October of 2017, the Center for Investigative Reporting sought EEO-1 diversity reports from over 200 tech companies, including the 150 top publicly traded companies. They found that just 23 of these companies released form EEO-1, and that gender and racial/ethnic diversity in employment and management remain quite far from parity with the general population.9 For example, there were no Black, Latina, or multiracial female executives at eight of the 23 companies, including Adobe, Google, and Lyft, and top tech firms including Google and Apple had less than 25% women employees. Against this backdrop, we attempted to understand the demographics of the overlapping fields we explore in this report.
Racism, sexism, classism, ableism, transphobia, and other forms of oppression permeate the tech sector, and the non-profit, community, and public tech sectors we looked at are not immune. The broader tech sector has slowly begun to pay attention to these problems, but diversity and inclusion initiatives in the larger tech industry are still not enough.10 Our study participants and project partners have no easy answers for what to do about these massive challenges. Some feel it is most important to create our own ecosystems and firms for community autonomy; others emphasize the need to modify organizational culture using best practices in training, hiring, and mentorship. A few suggested a dedicated project to focus on pushing all actors to release demographic data, and to publicly set equity targets and timelines. 11 Unfortunately, despite recent attention to race and gender disparity in the broader tech sector, the fields we analyzed lack demographic data. Key actors in the space, including the biggest players (such as Code for America and the Knight Foundation), have not historically tracked or shared demographic data about employees, volunteers, leadership, or grantees. In a complex world, many strategies for diversity, inclusion, and equity are necessary. All participants agreed in at least one area: we know that it will be crucial to gather and share demographic data about field participants, and to publicly set equity goals with timelines.
DEMOGRAPHICS OF STUDY PARTICIPANTS
Although the overall ecosystem lacks demographic data, we were able to gather demographic data about our study participants. This section describes those who participated in interviews and/or focus groups for this project, the majority of whom also completed a demographic questionnaire. A total of 188 individuals participated in our research, including 79 focus group participants and 109 interviewees. A total of 121 individuals (64% of participants) completed the demographic questionnaire. The participant demographics presented below highlight the backgrounds, skills, and sectors of individuals working across the ecosystem who participated in this study.
Participant Race/Ethnicity & Gender Identity
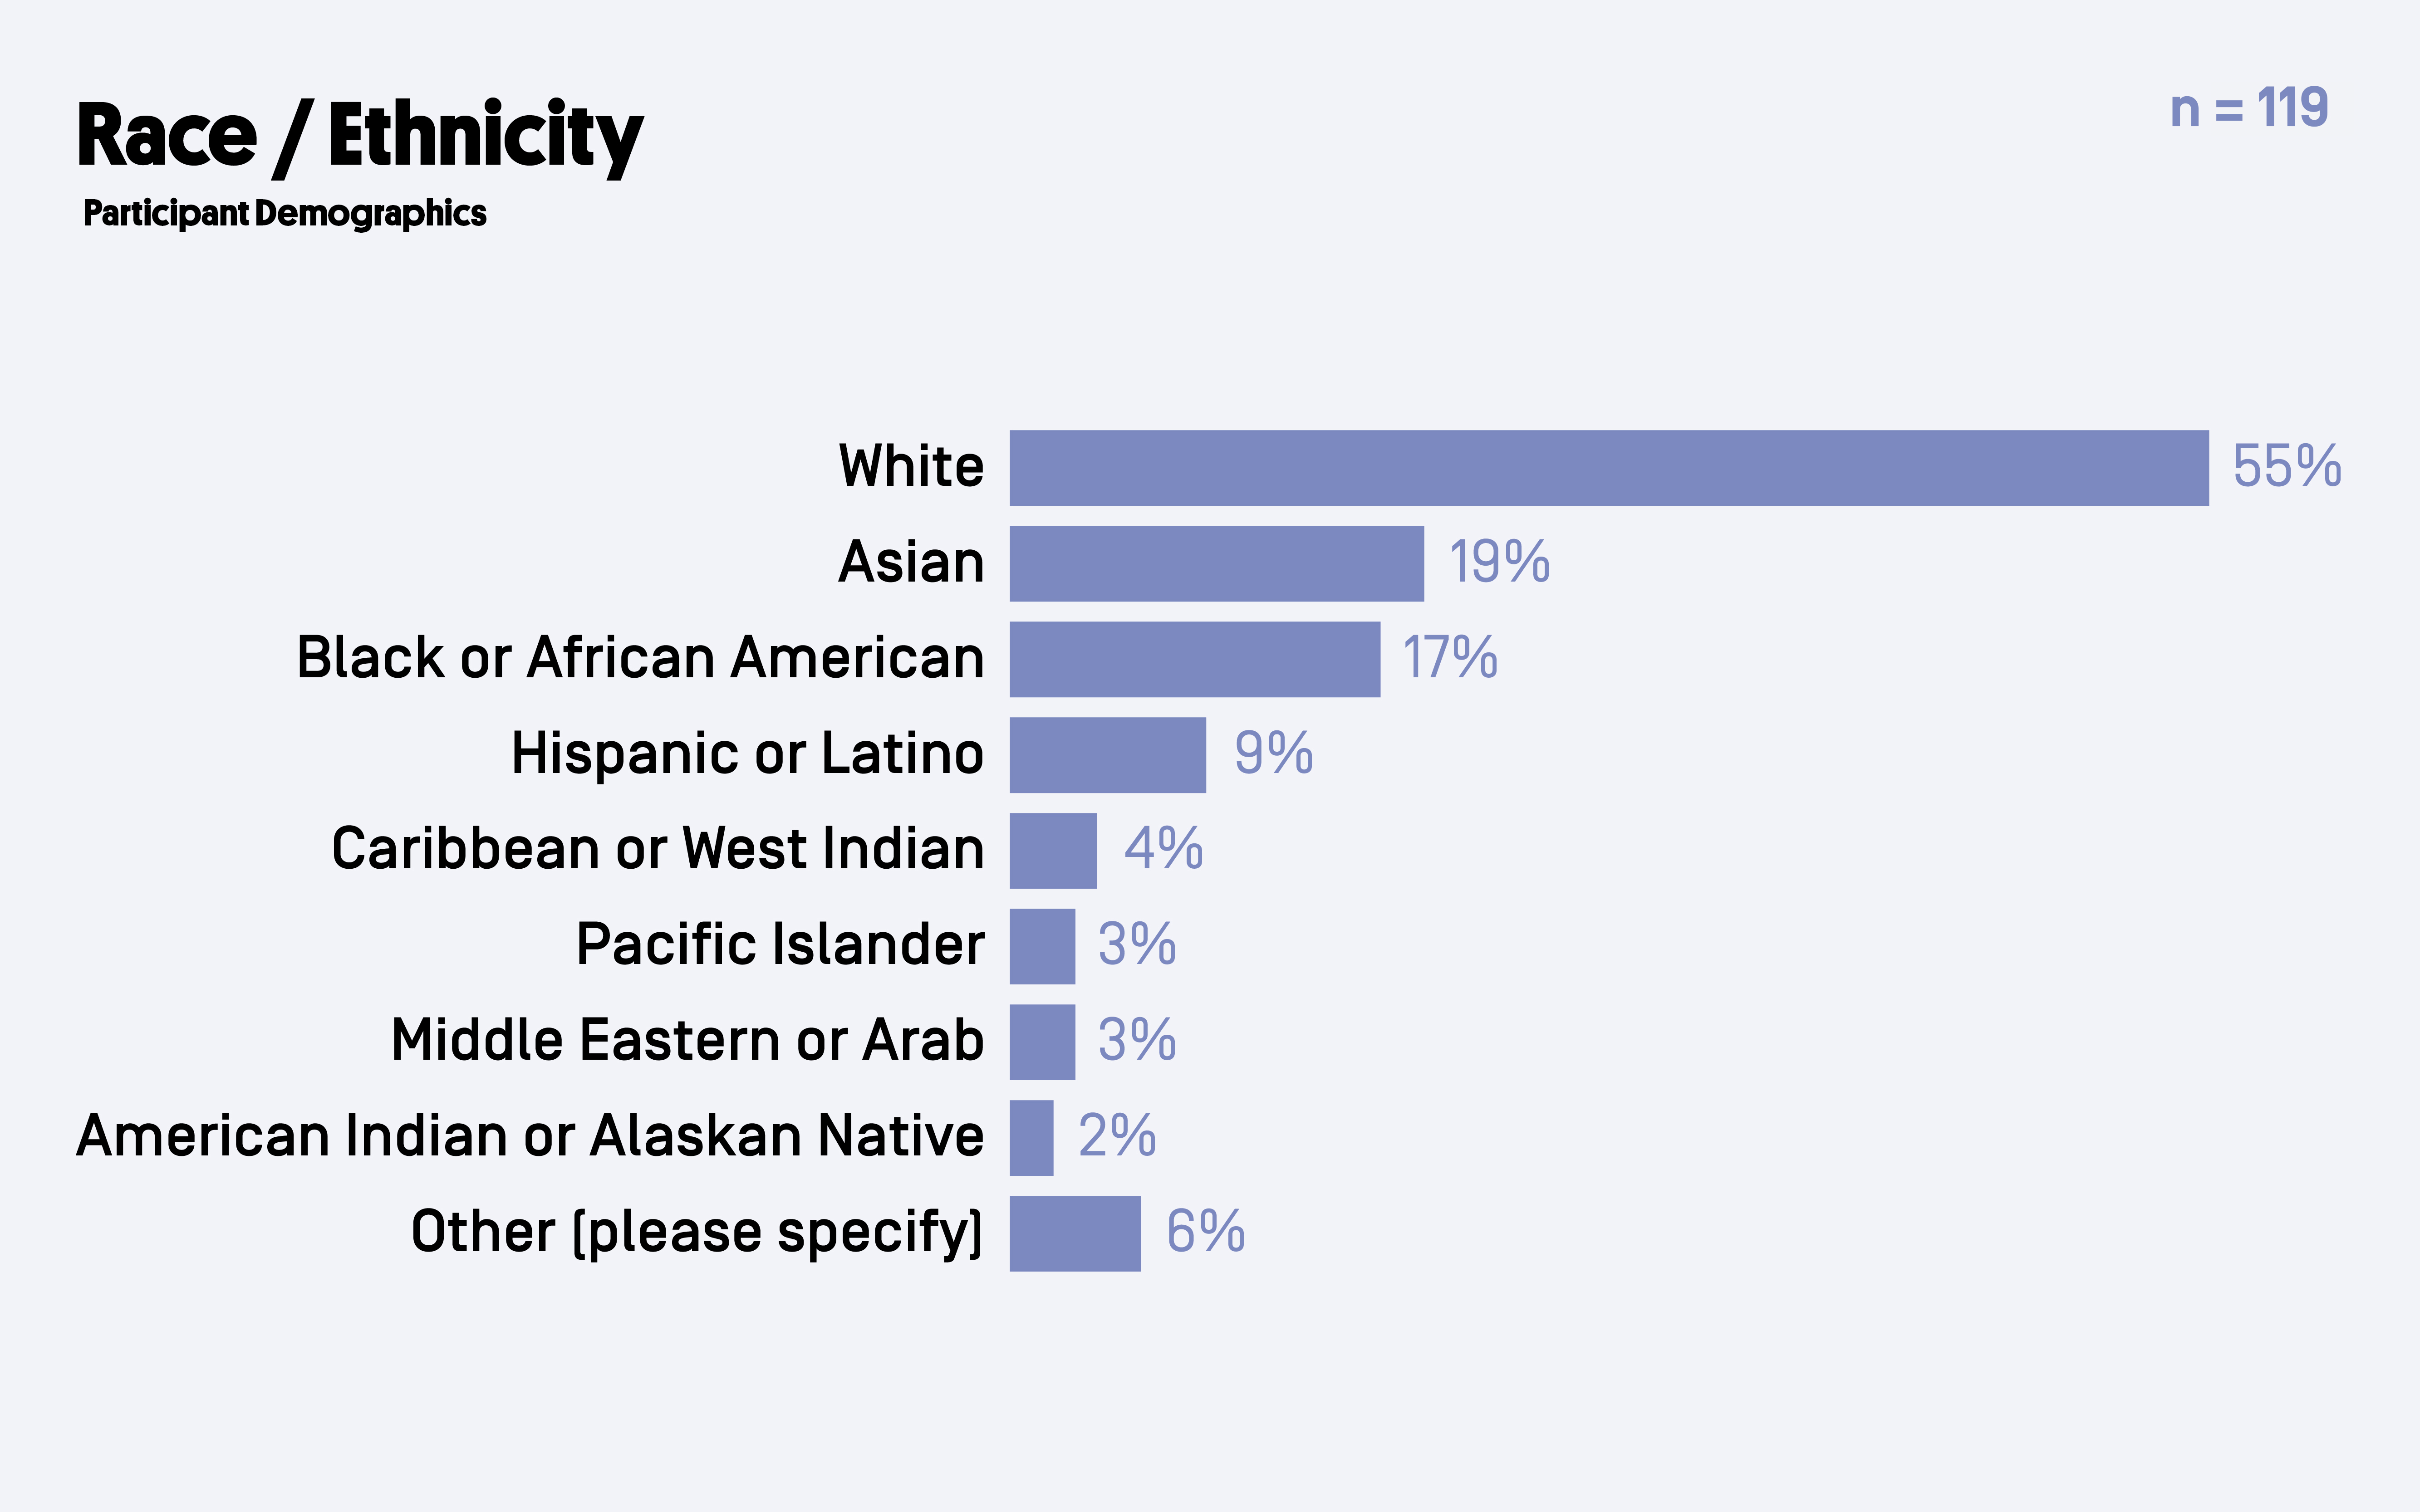
The majority (55%) of the 121 study participants who completed the demographic questionnaire identified as White.
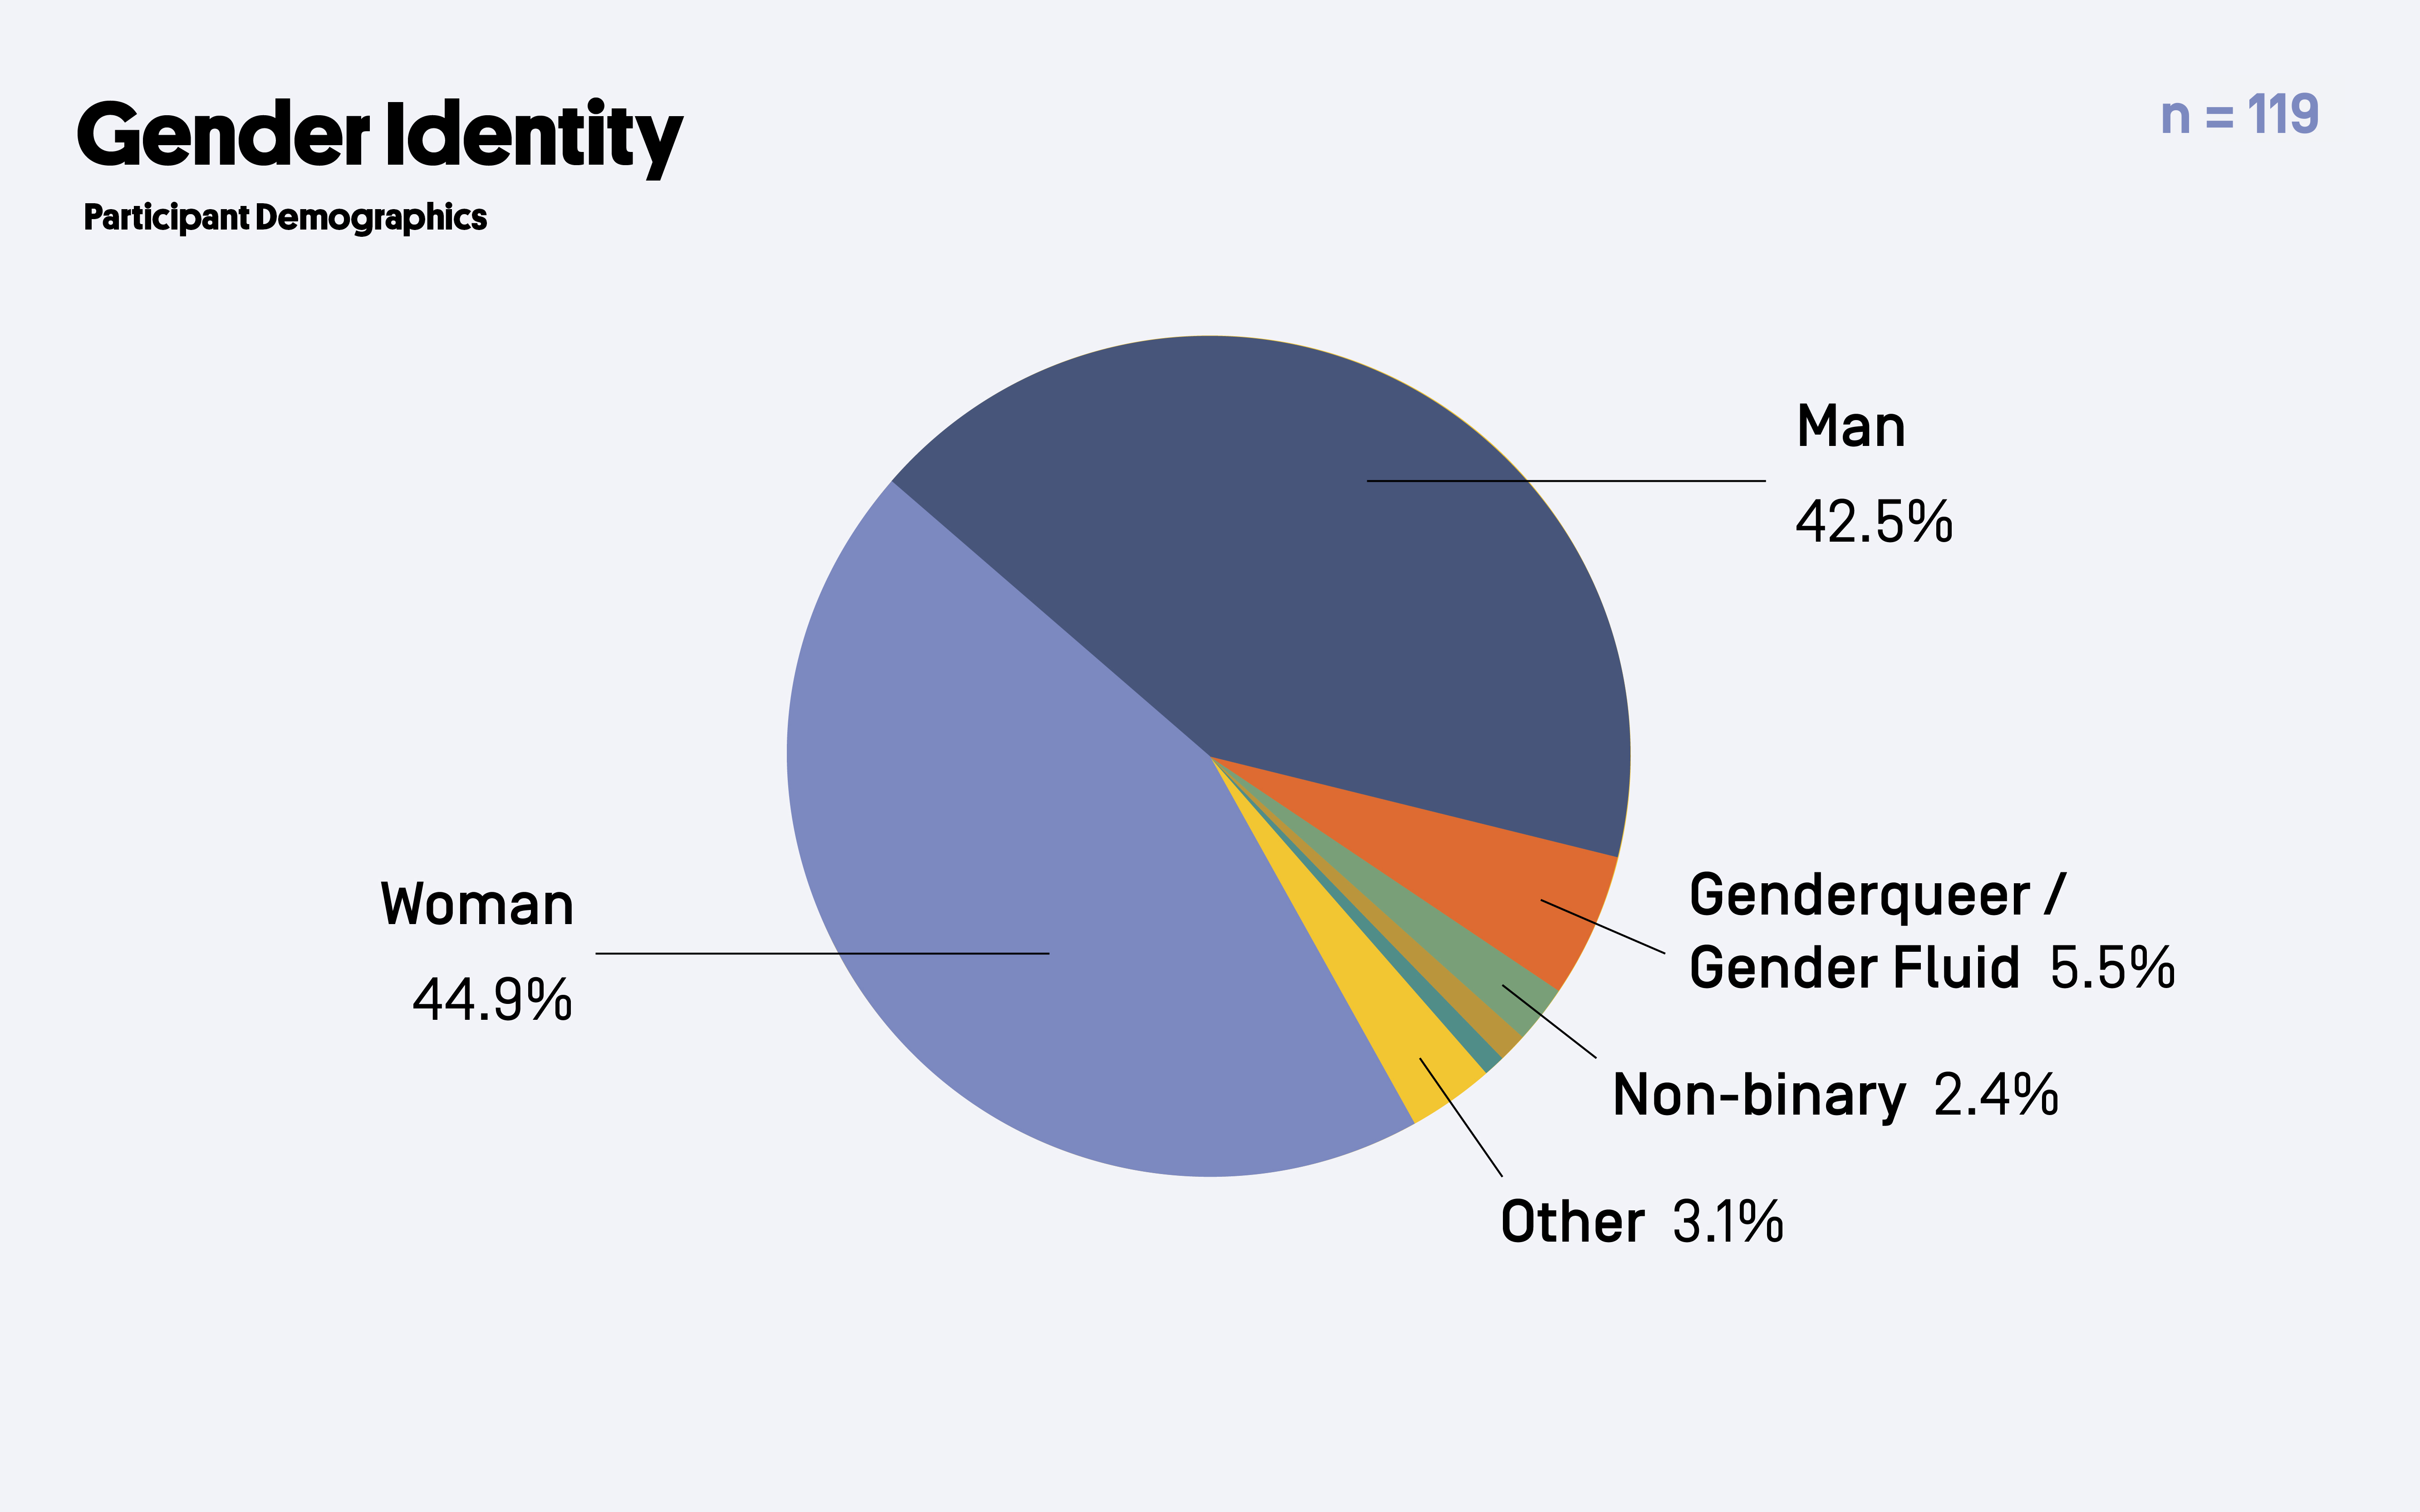
There were slightly more women (45%) than men (42.5%). 11% identified as either Genderqueer/Gender fluid, Non-binary, Trans Woman, Trans Man, or Other. Respondents who chose Other (3%) identified as Queer or Genderqueer only, Butch, or stated they never identified with any label.
Participant Professional Identity
With respect to professional identity, most participants selected Technologist (52%) and/or Community Organizer (40%) to identify their roles in the field. Developer/ Coder, Educator, Tech Project Manager/Coordinator, and Researcher were also among some of the top professional roles selected by participants; about a third of participants identified with each of these terms.
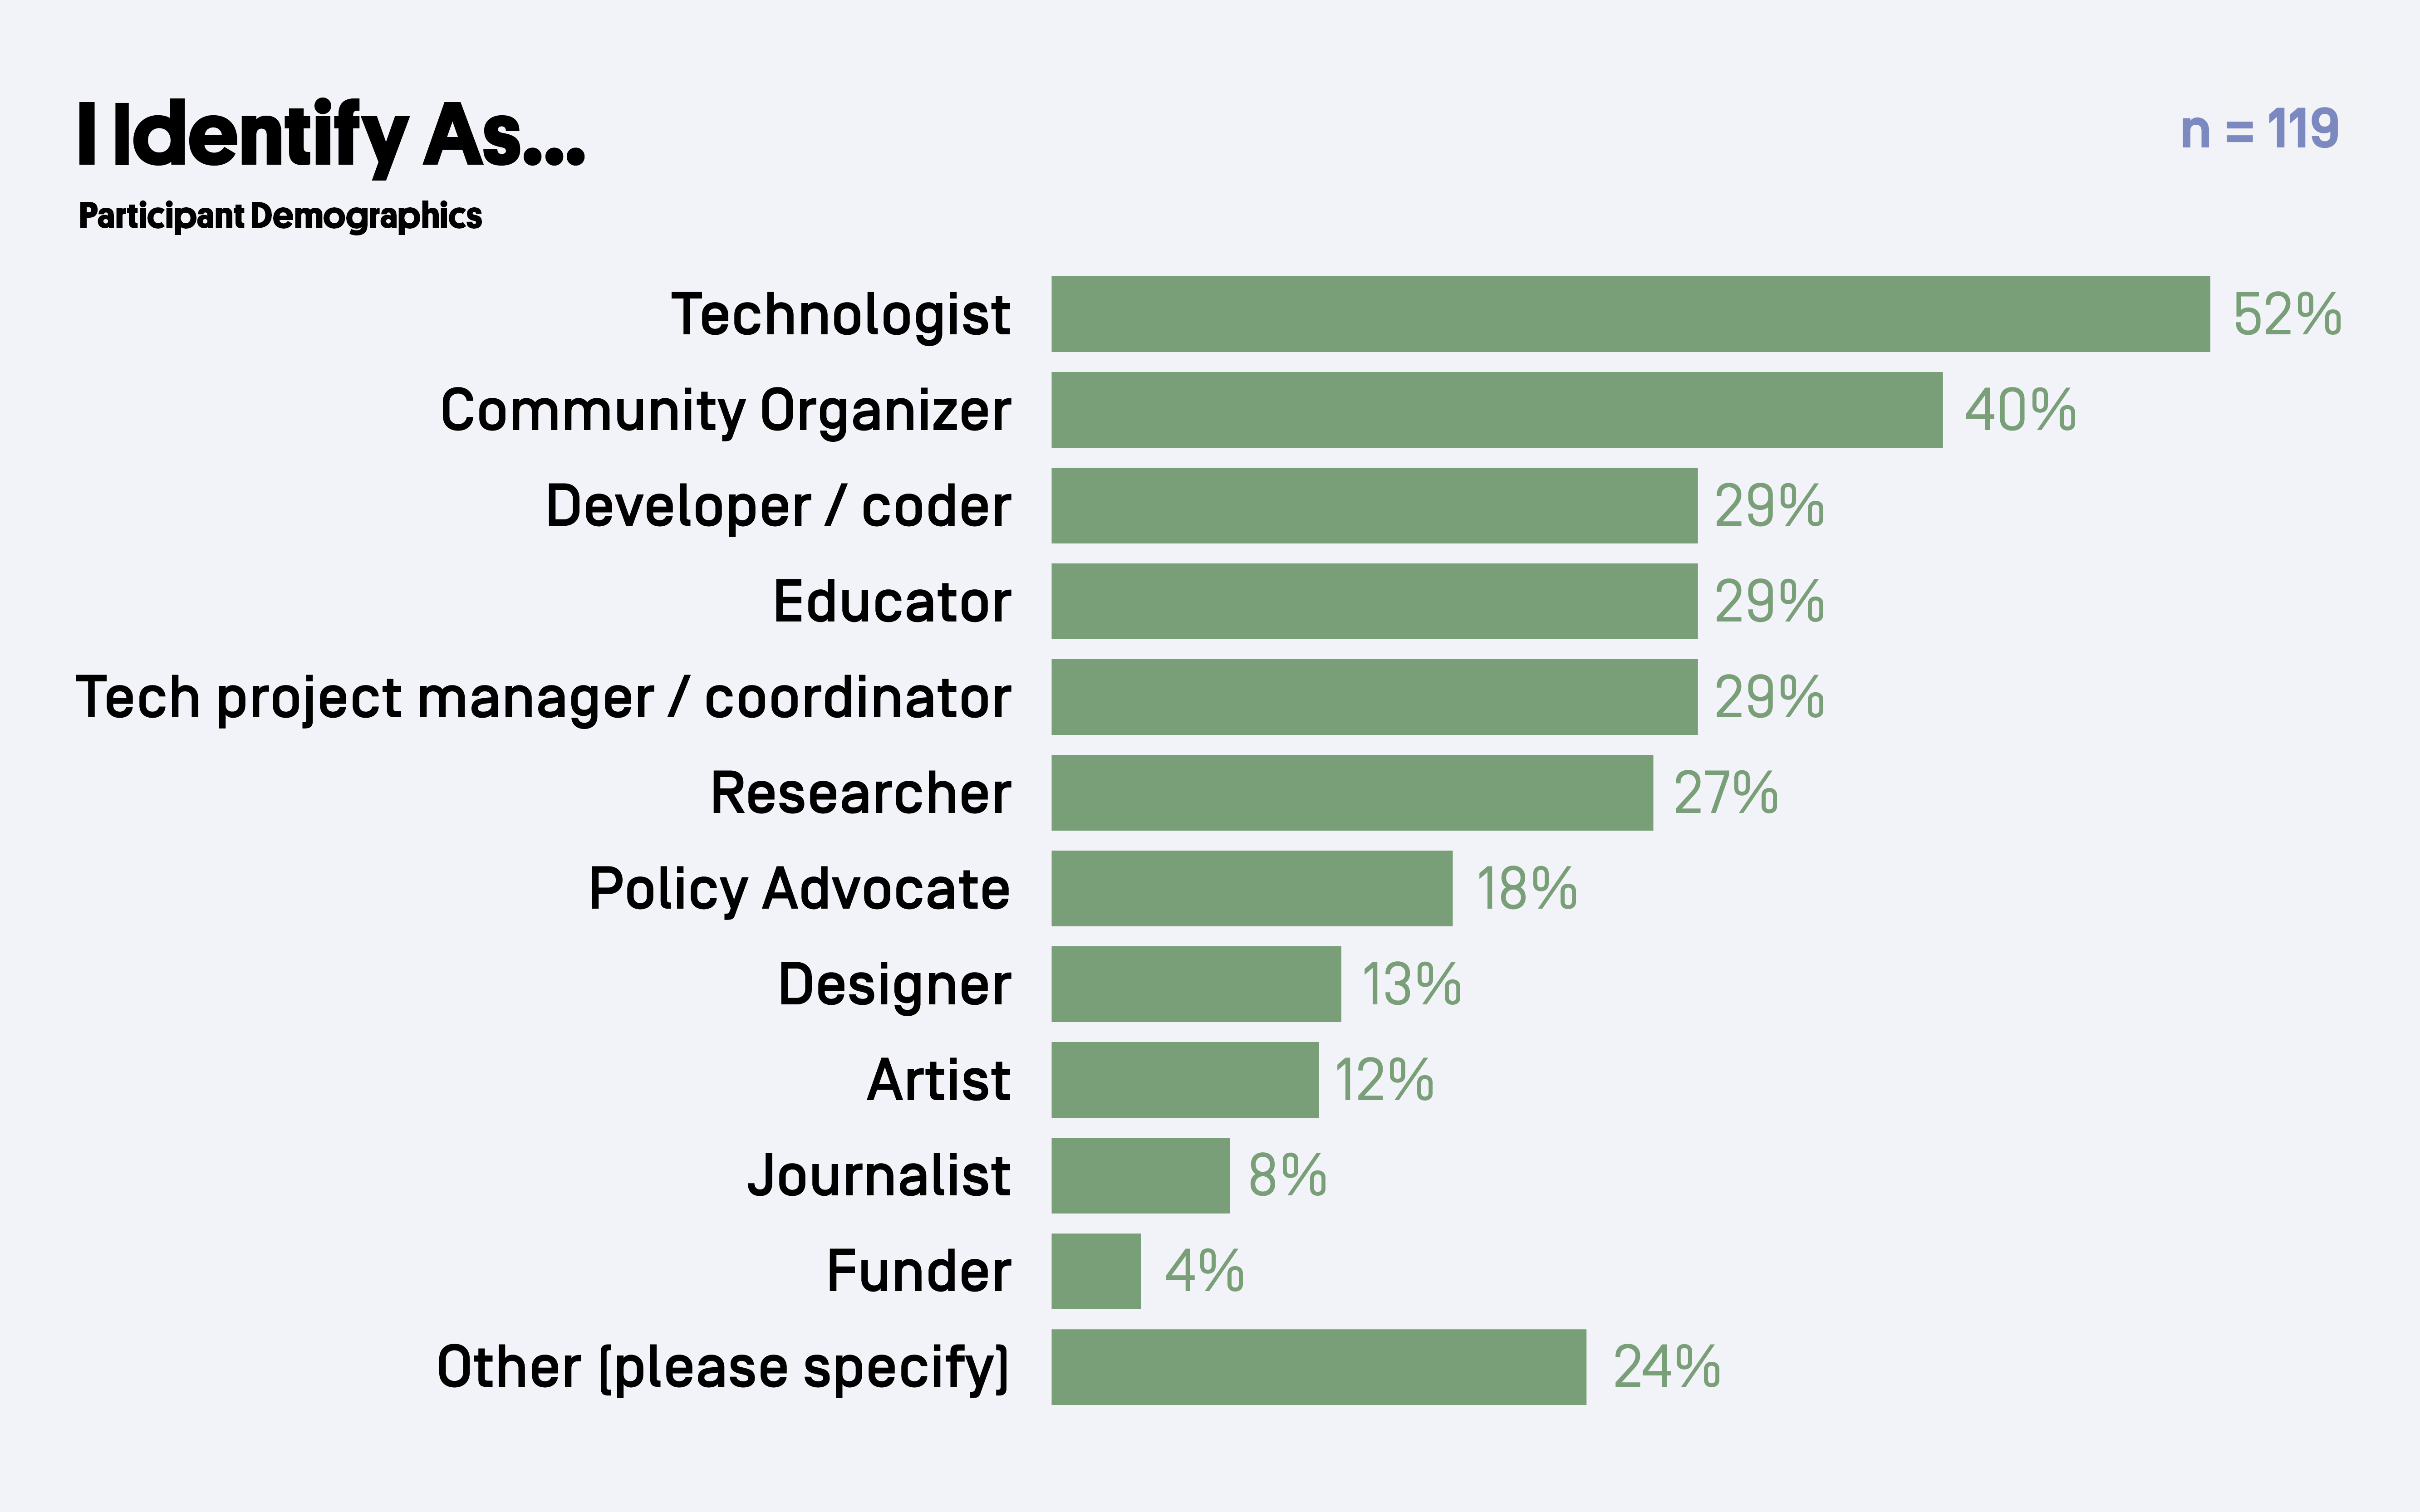
Those who chose Other (24%) identified in a number of different ways, sometimes wearing multiple hats. This included specifying the area they focus on as a technologist, such as Community or Policy Technologist. There were participants who identified more with their position in an organization, such as Executive Director, Administrator to Project Manager, or Political Staffer. Some participants identified most with their profession or field of study, stating they were Lawyers, Anthropologists, or Writers. Others described their role as Activist, Gamer, Media Maker, Advisor, Strategist, Social Innovator, or Facilitator.
Participant Age
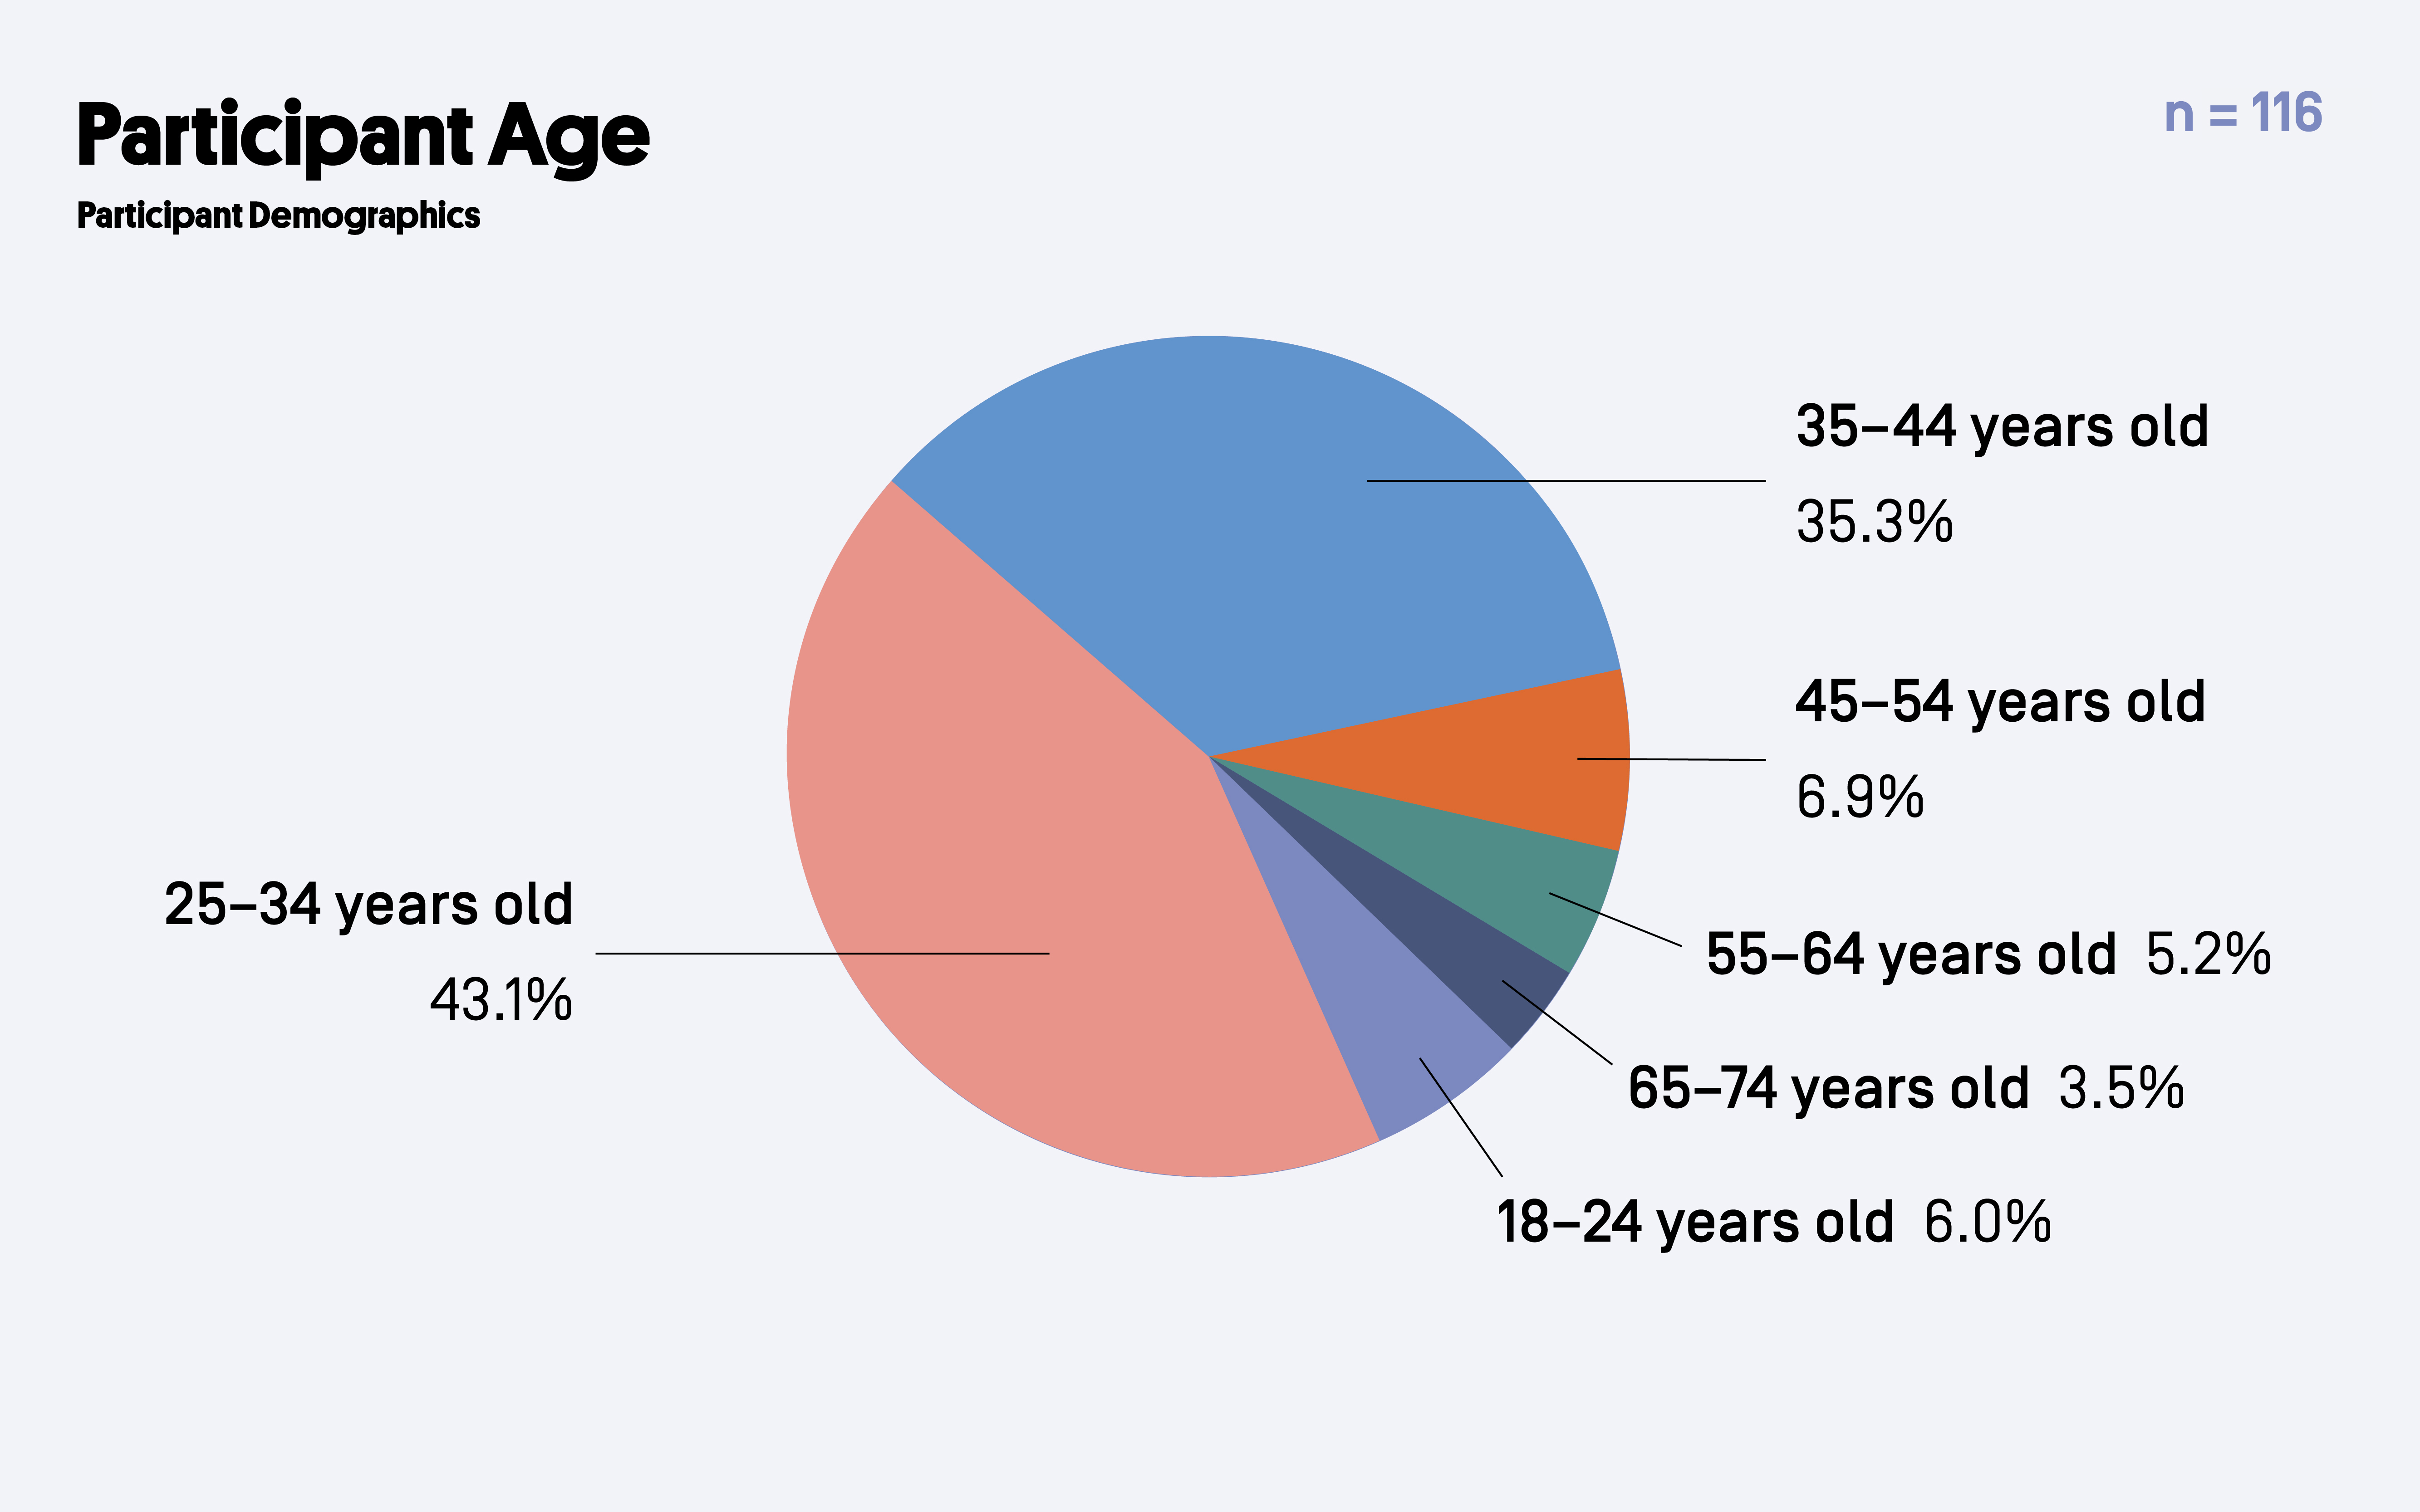
The majority of individuals (78%) fell between the ages of 25-44. Others (16%) fell mostly in the 45 and older age range. Just 6% were 18-24 years of age.
Participant Education Levels
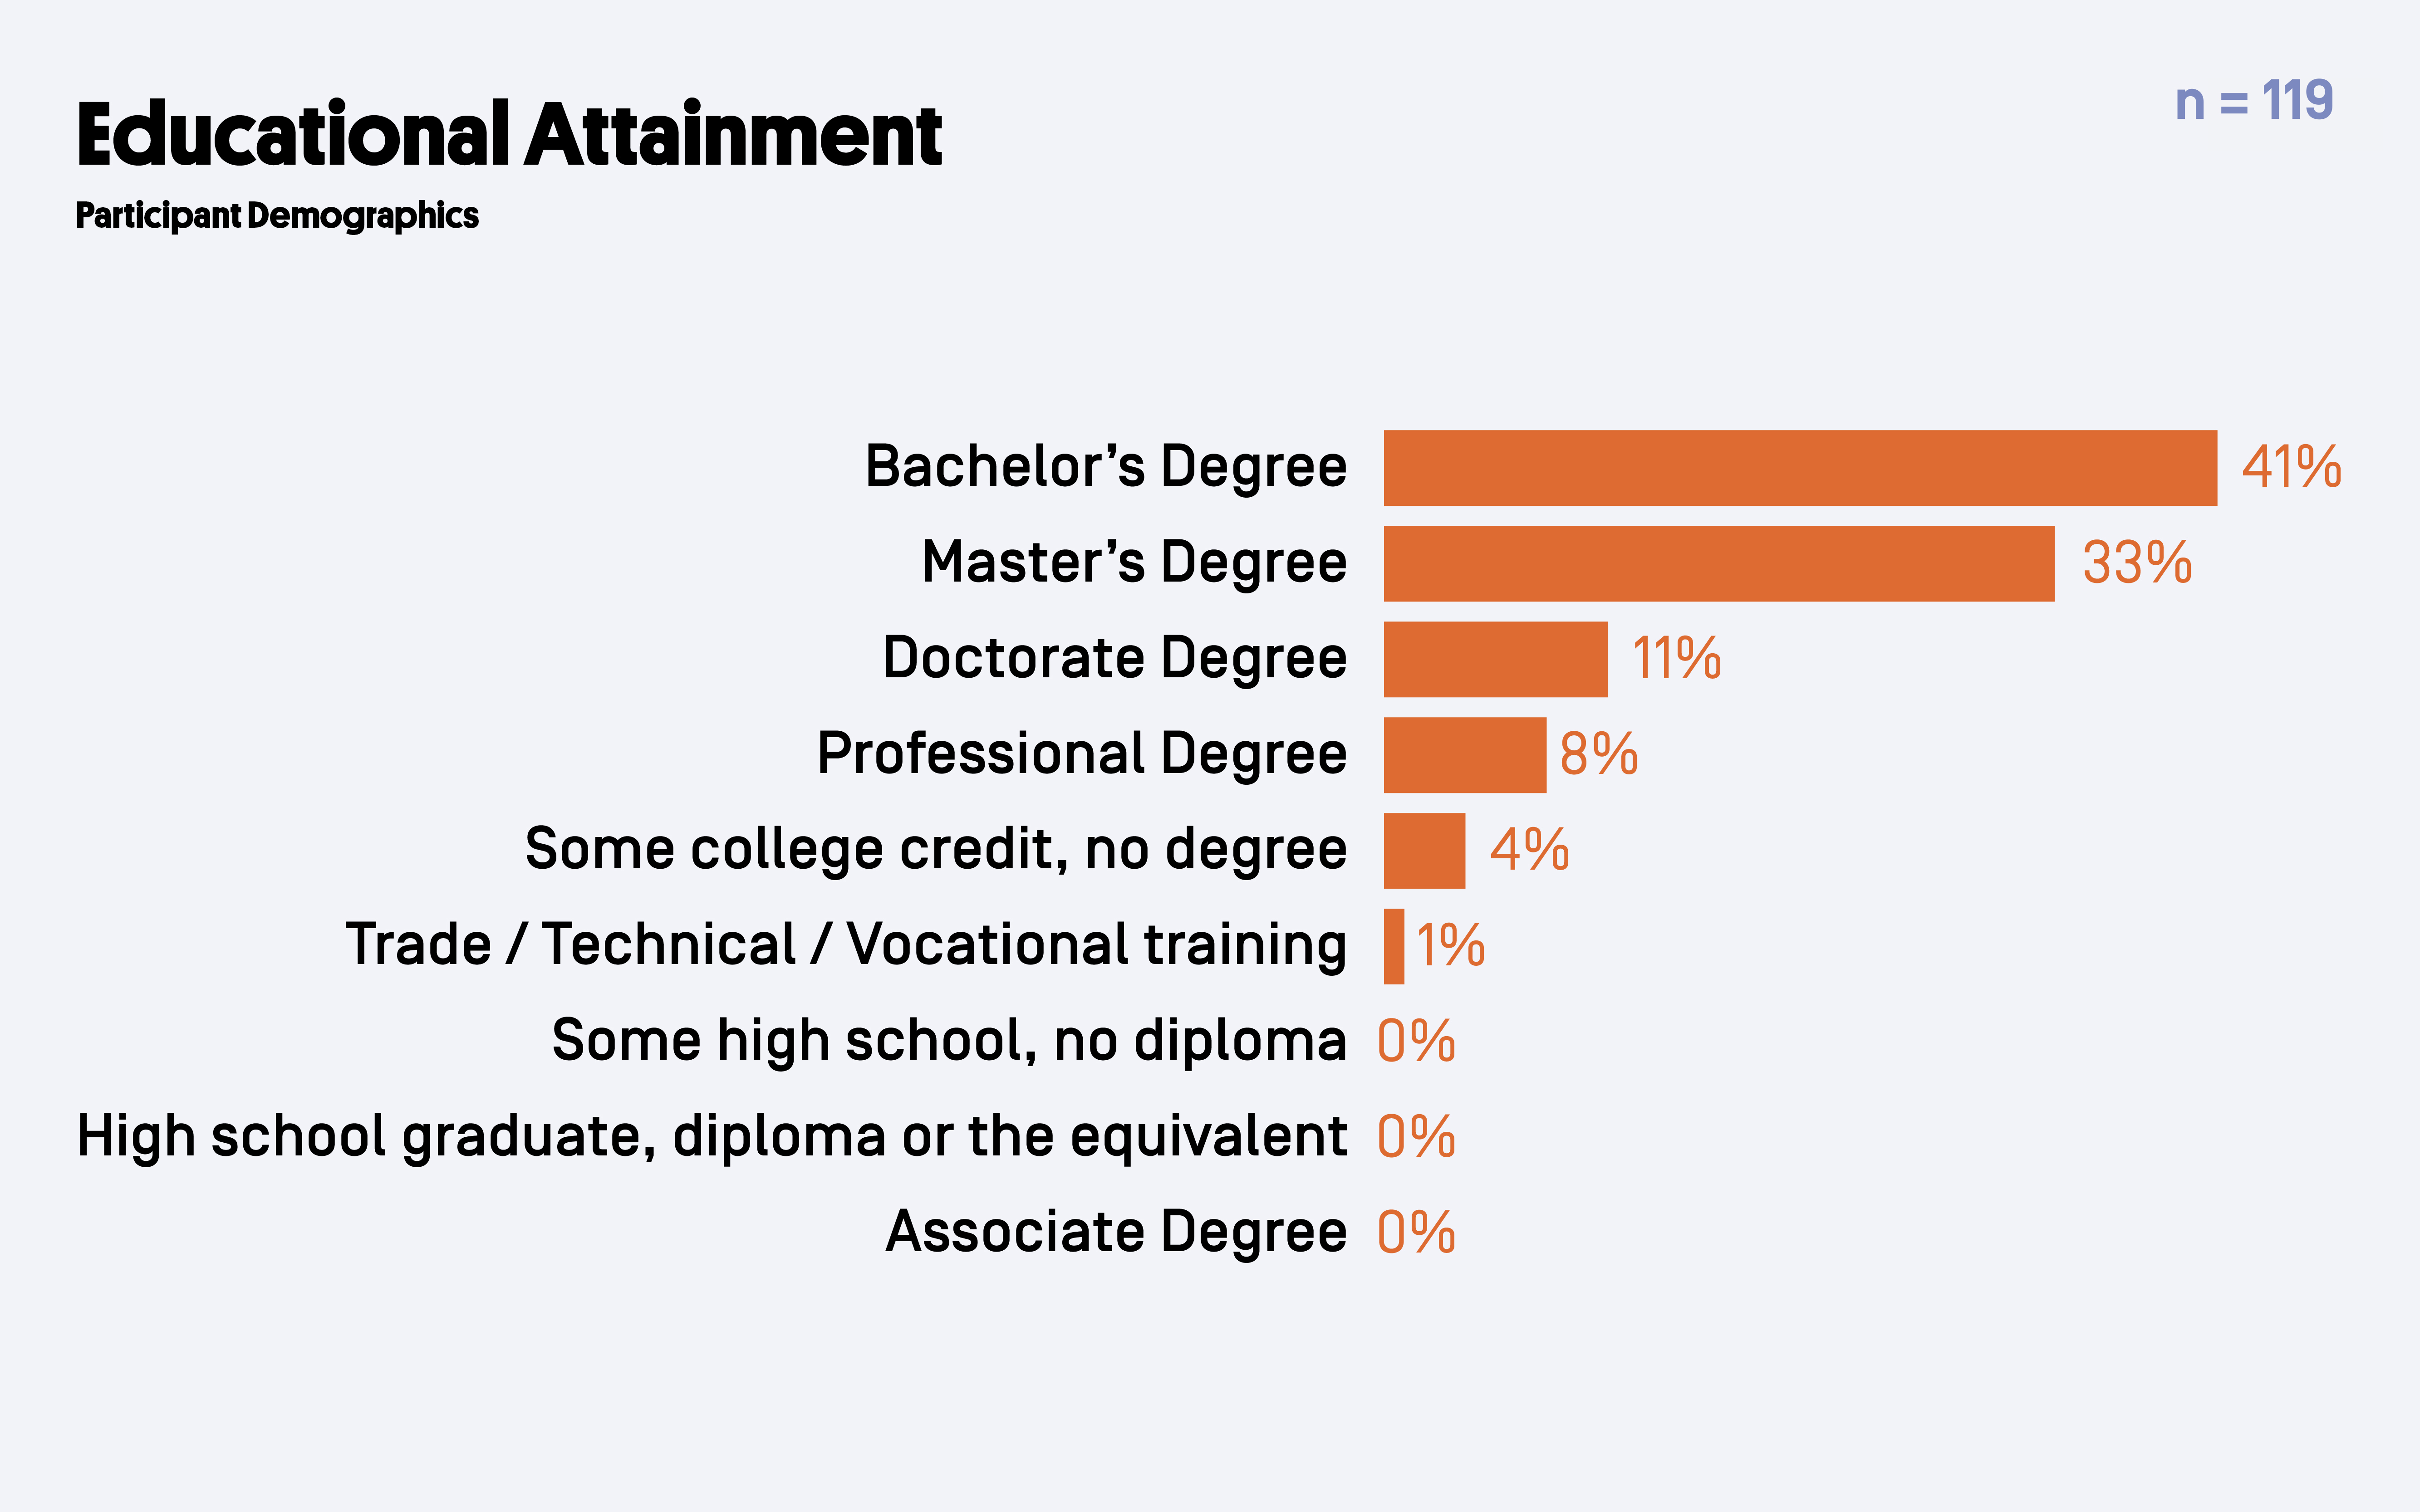
Study participants are mostly college educated, holding either Bachelor’s (41%), Master’s (33%), or Doctorate (11%) degrees. Degree subject areas spanned from Political Science, Law, English/Literature, Media, Arts, and Education to Mechanical and Computer Engineering, Physics, Information Systems, and Computer Science.
Sector/Type of Organizations and Geographic Scope
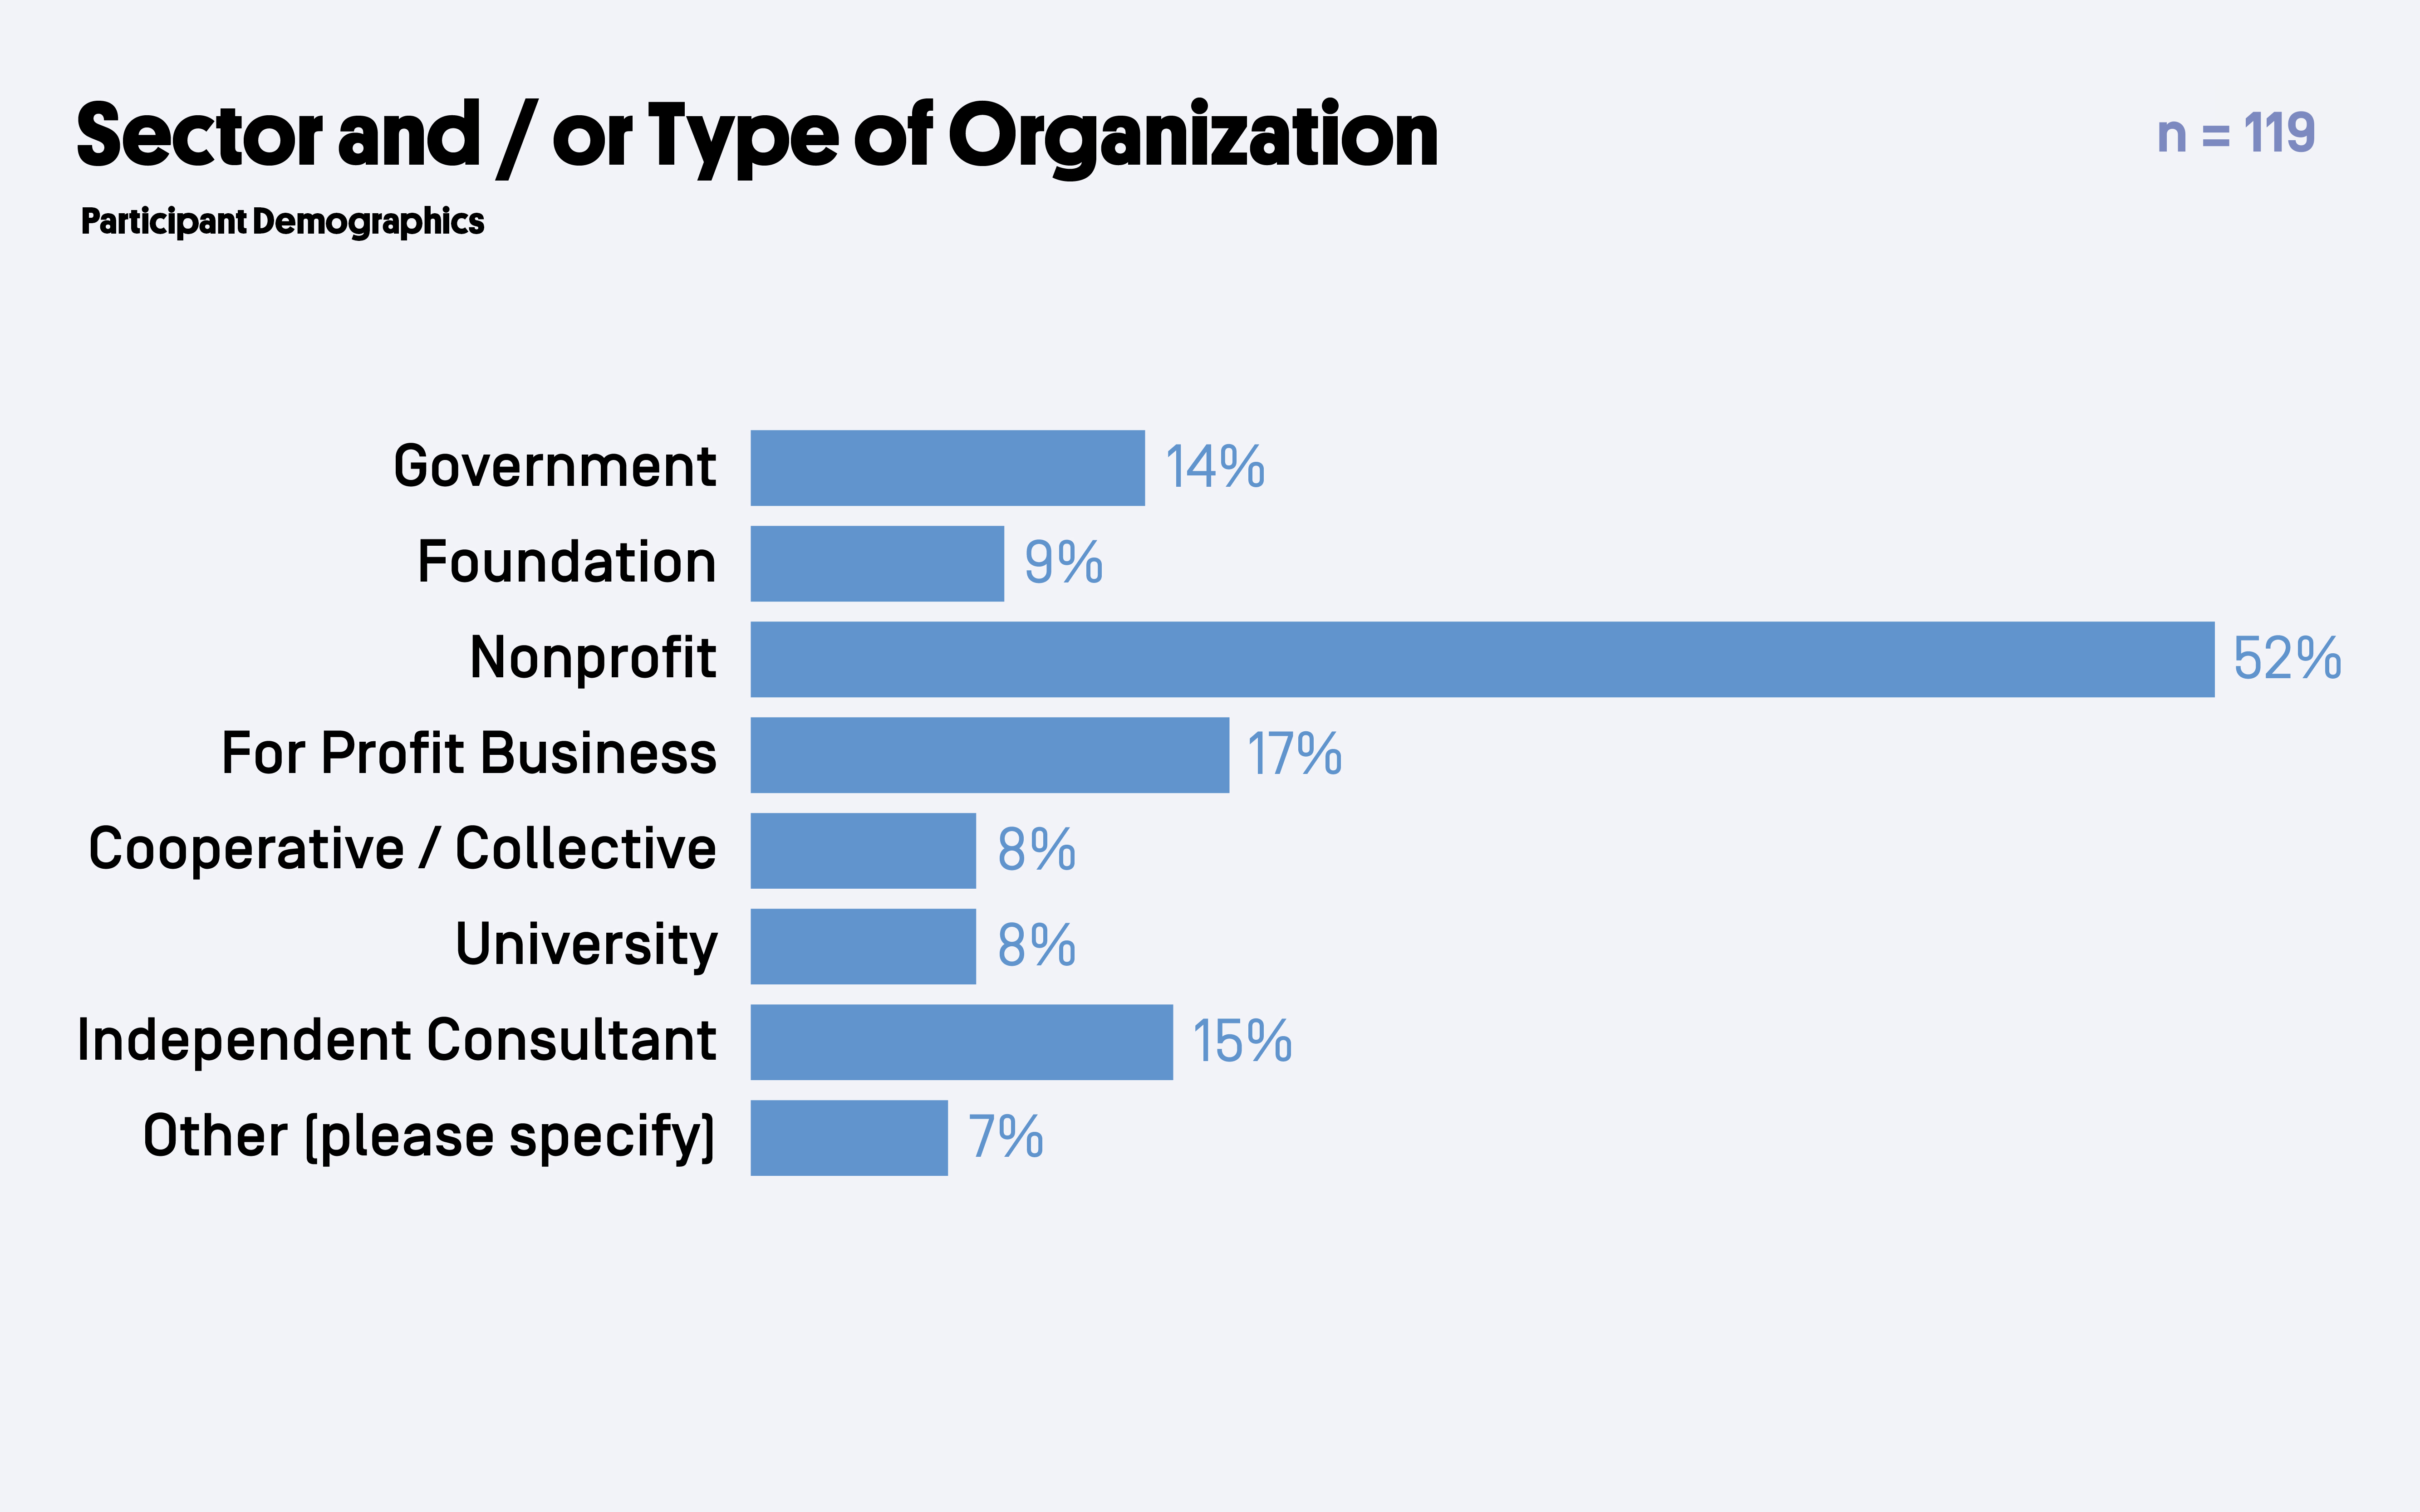
Study participants mostly work in the nonprofit sector (52%). The two other relatively prominent sectors represented are For-Profit Business (17%) and Government (14%). There were also a number of Independent Consultants (15%) who work across different sectors.
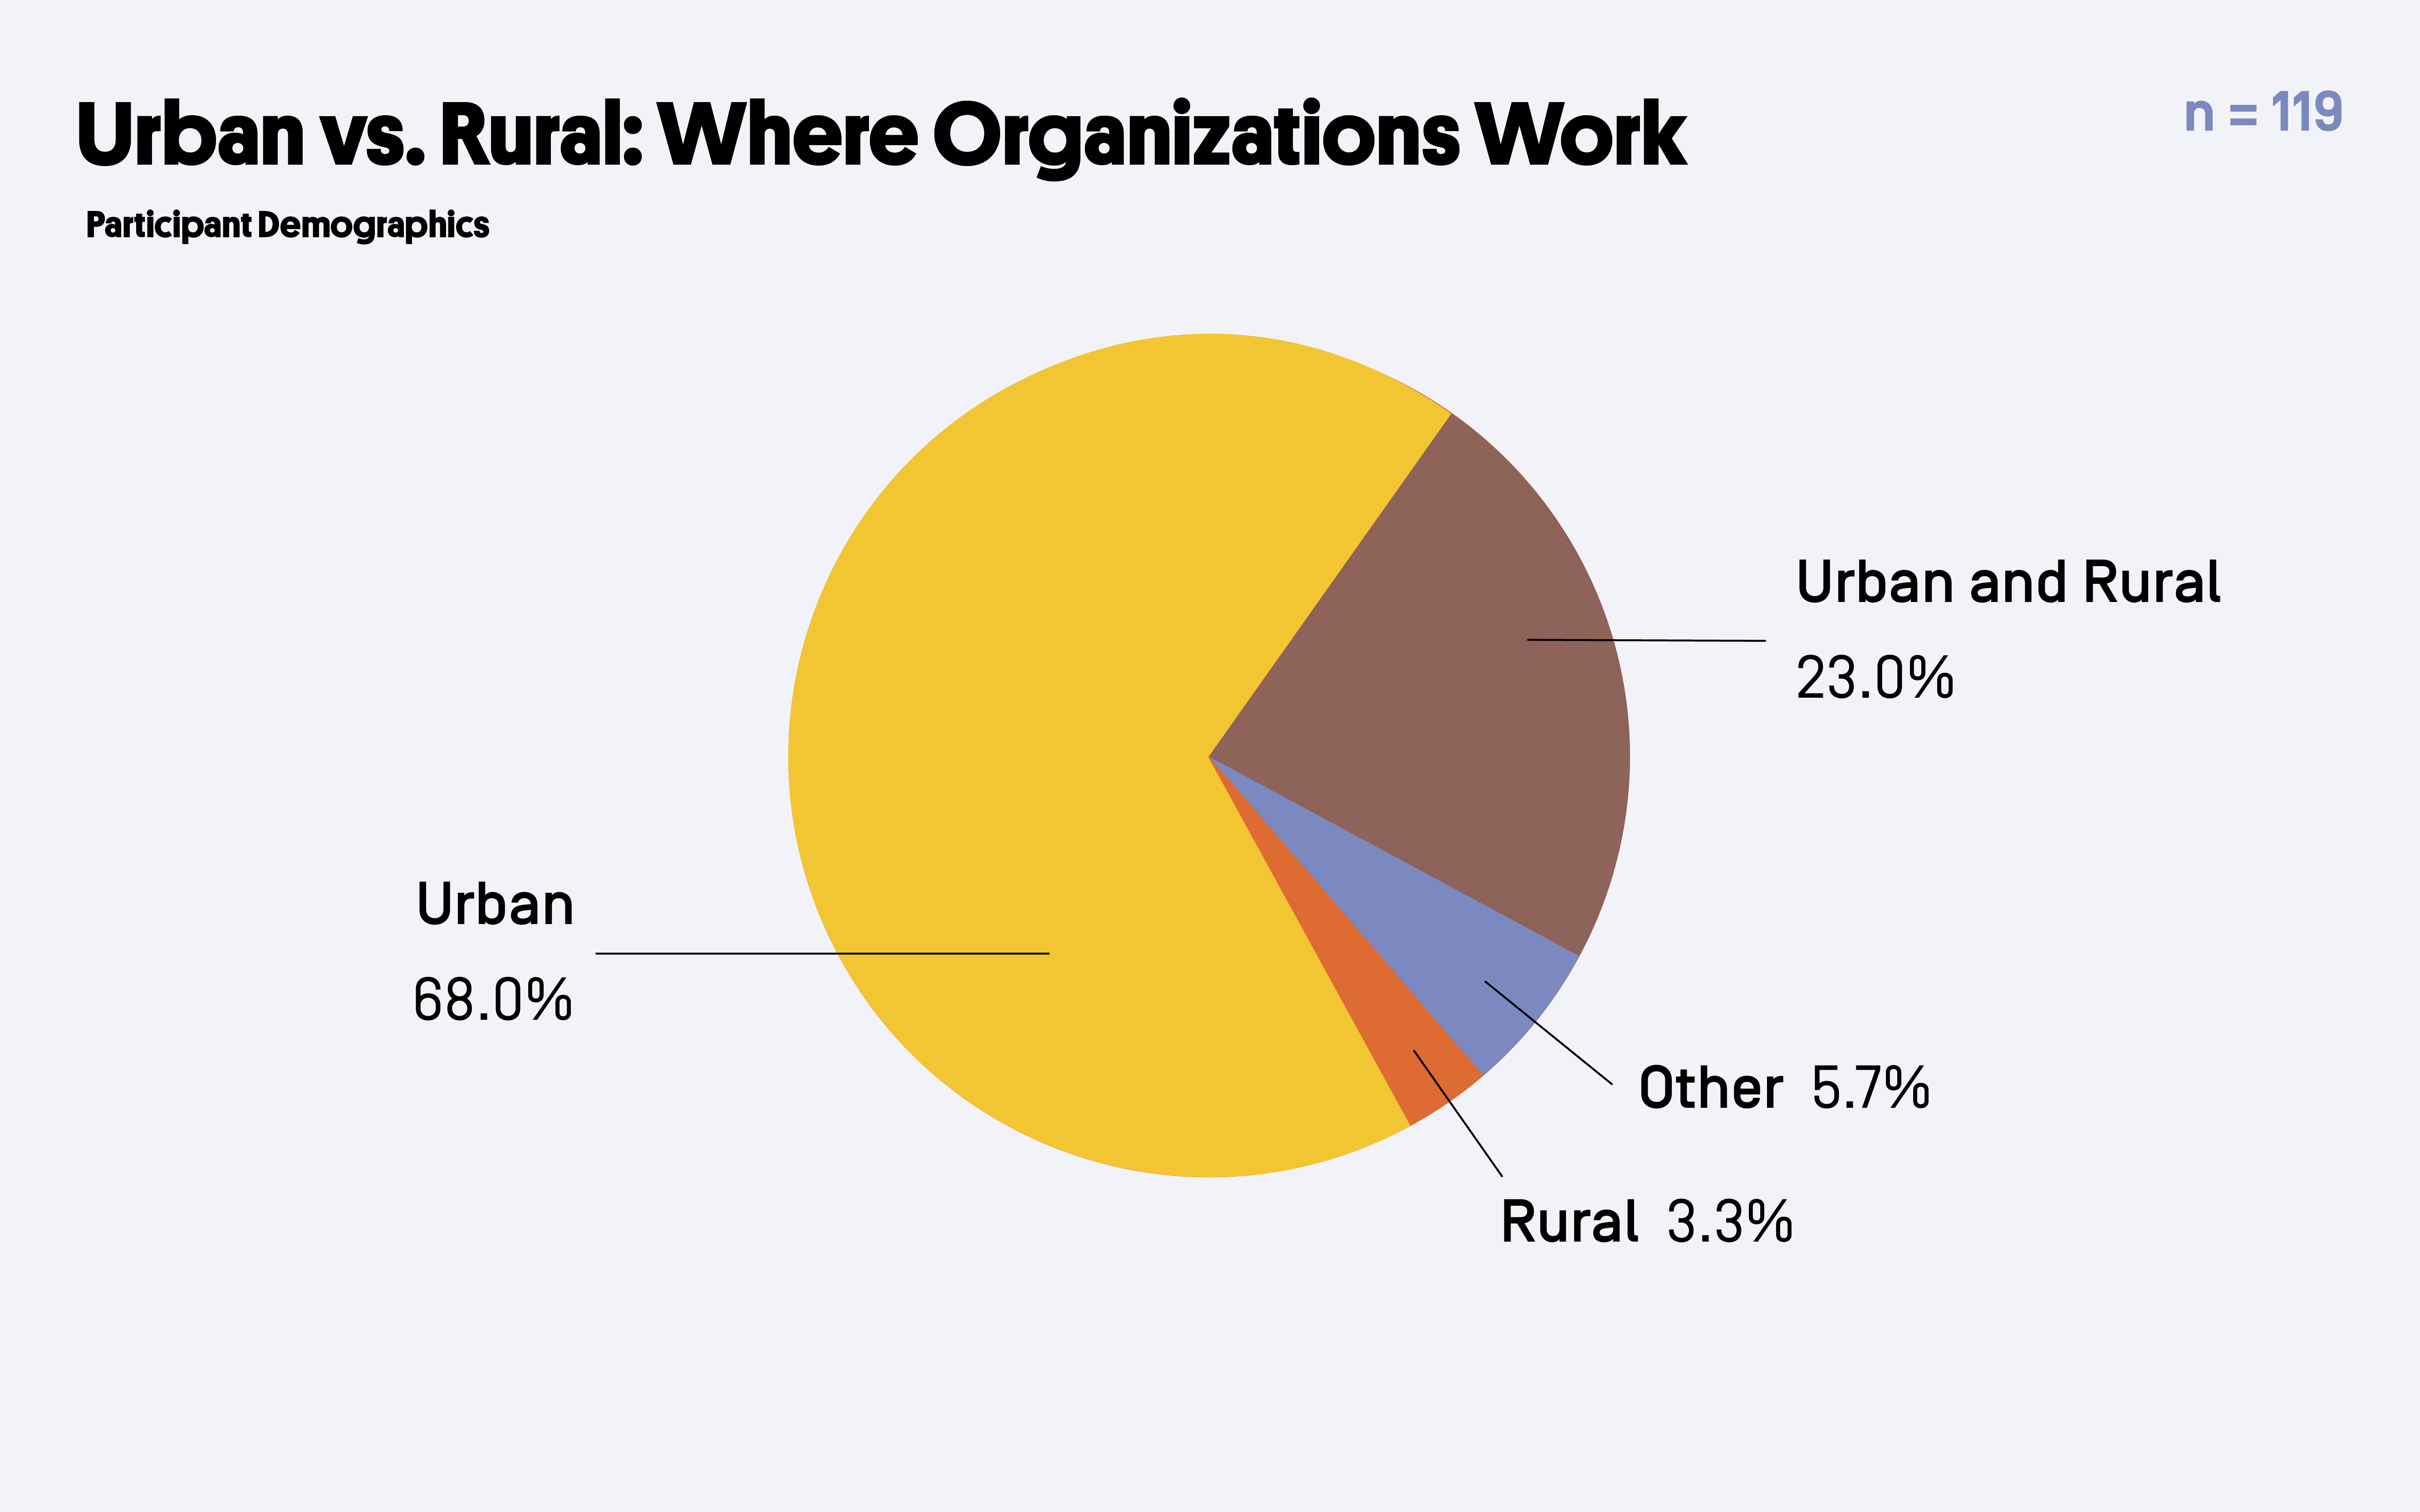
Geographically, participants are mostly based in Urban (68%) or Urban/Rural (23%) regions.
####Participant Income Levels
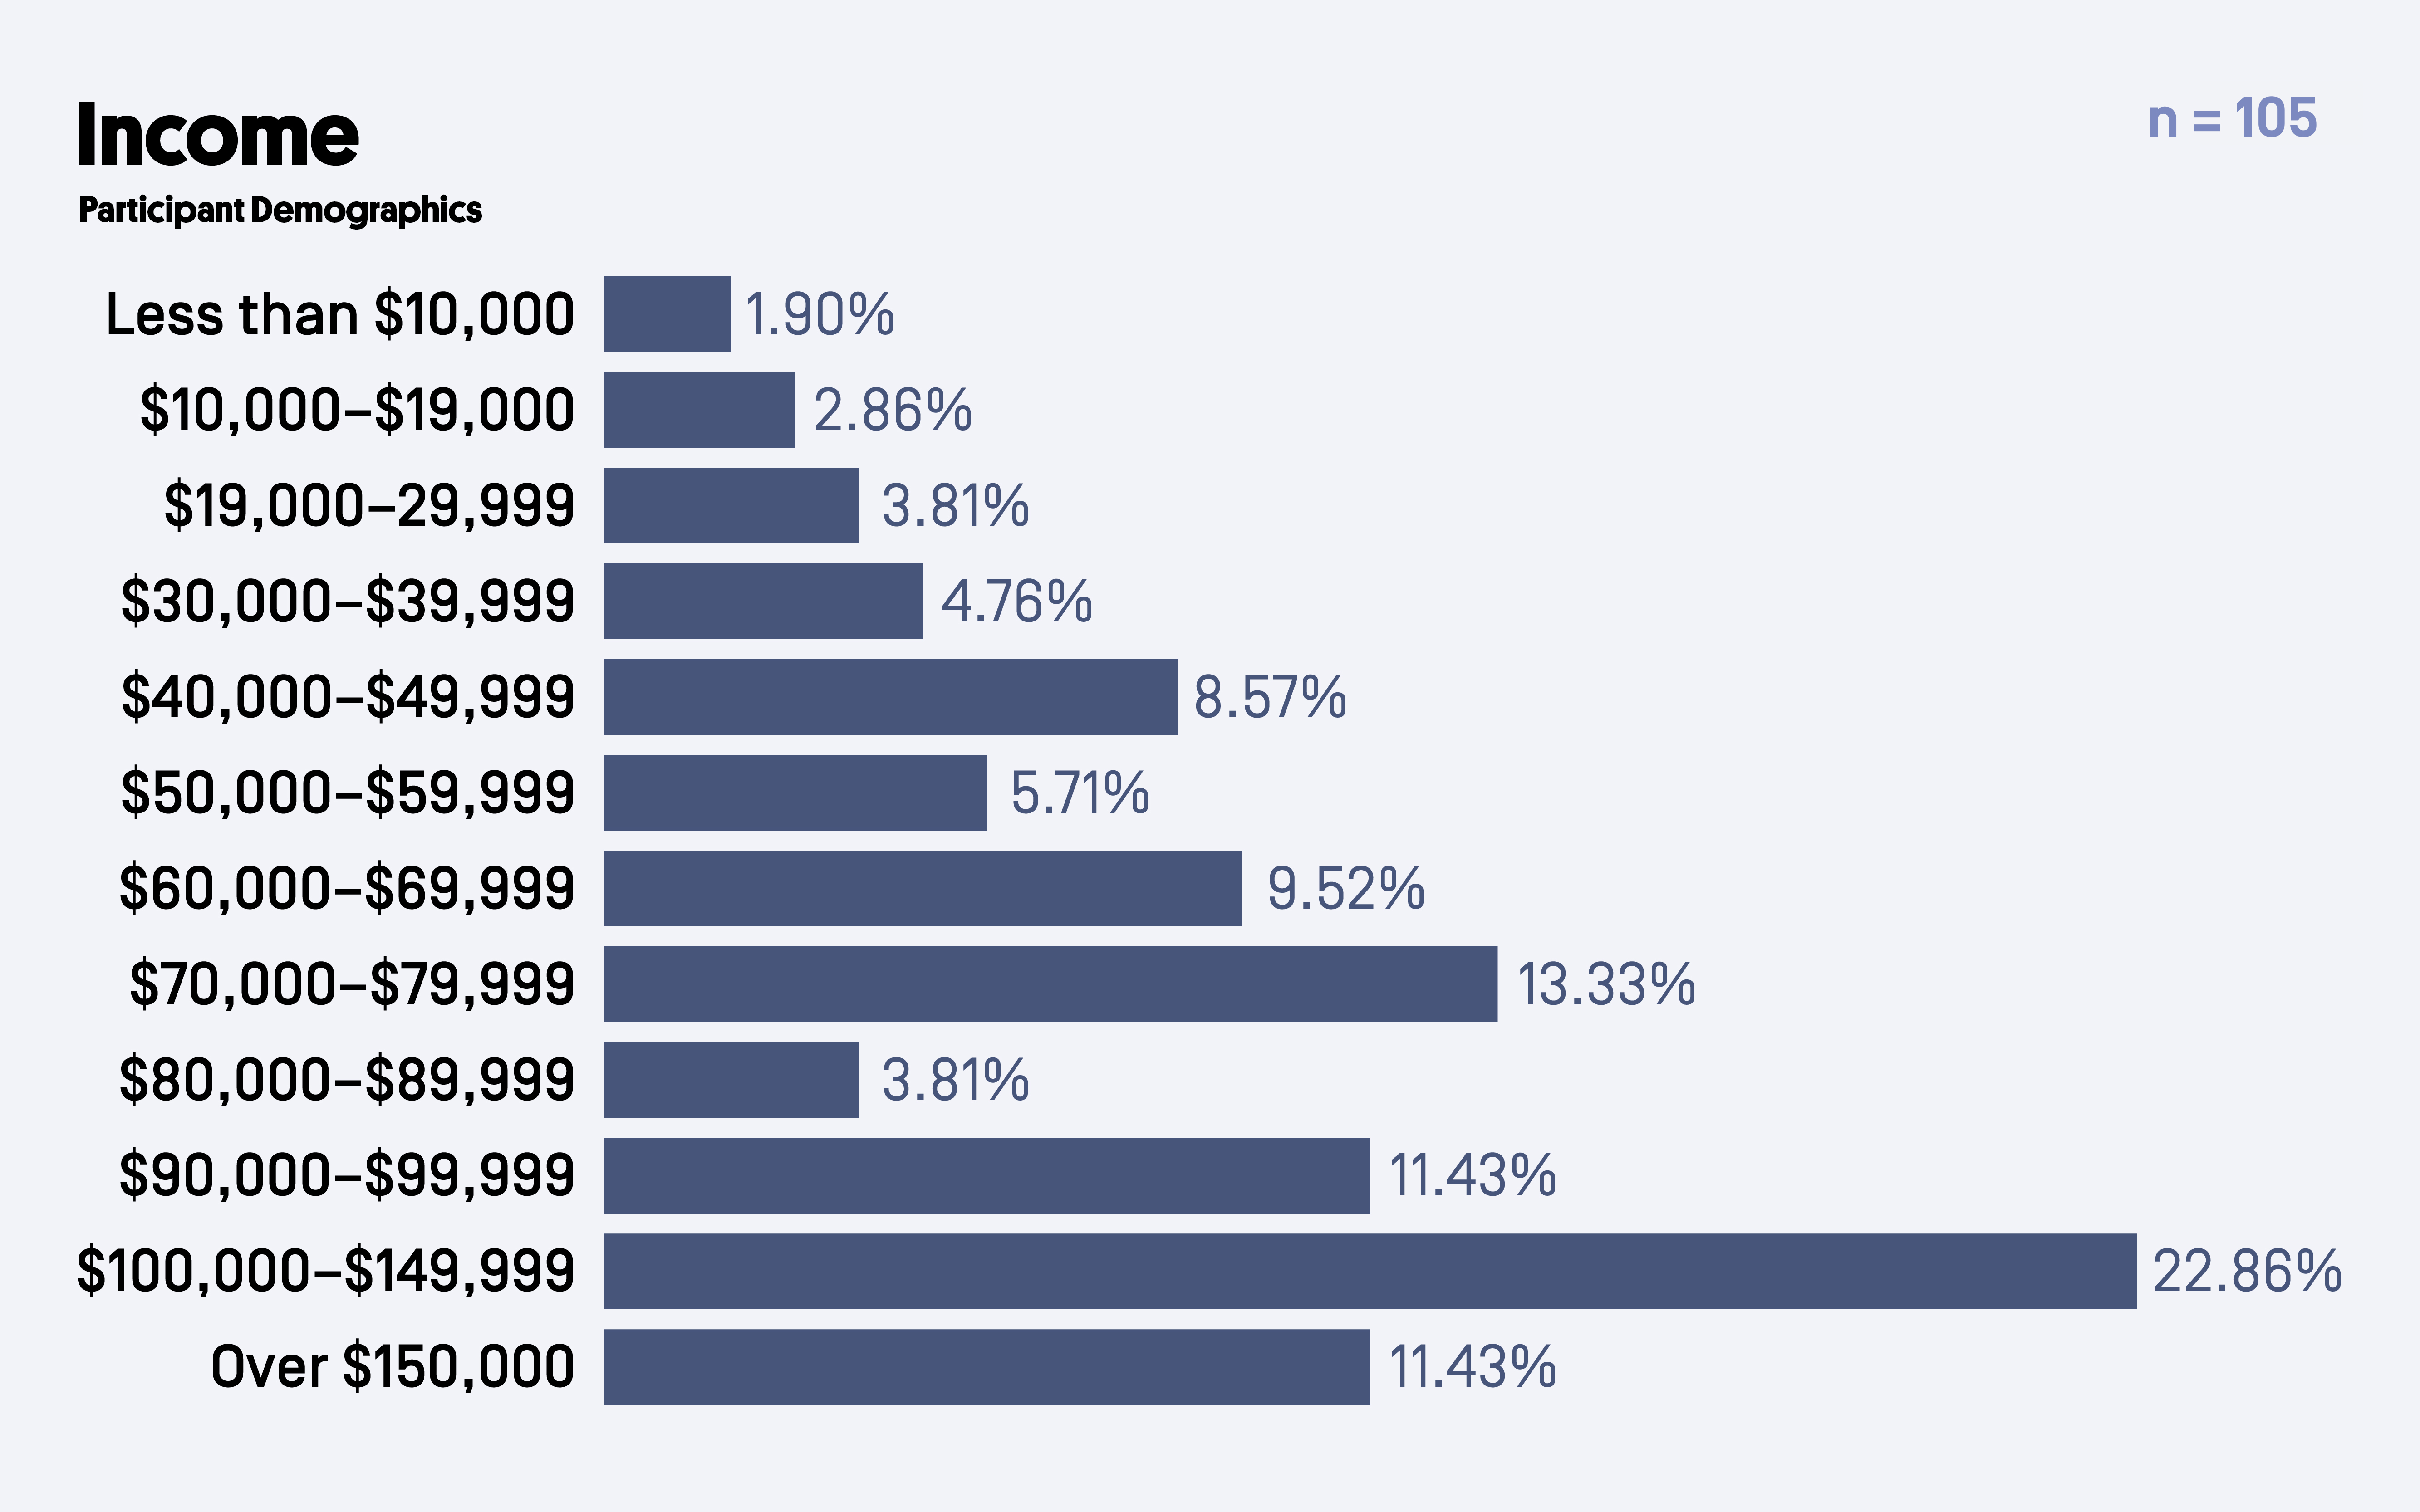
Almost half of study participants earn $80,000 or more annually. However, we believe this figure to be skewed relative to most practitioners in the field, since most of our study participants’ job titles reflect senior-level positions, such as Executive Directors/ Founders/CEOs, Directors/Chiefs, and Managers.
